Understanding the dynamics of human populations is essential for economic planning, public health, and social services. Among the analytical tools available for this purpose, population pyramids and age structures stand out for their simplicity and effectiveness in visualizing demographic information. These graphical representations serve as mirrors reflecting the past, present, and often the future of a society’s demographic profile. However, many people are unfamiliar with how to interpret these vital graphics or appreciate their importance.
Population pyramids, at their core, are graphical illustrations that show the distribution of various age groups in a human population, typically separated by gender. When examined closely, they can reveal trends in birth and death rates, life expectancy, and potential social and economic challenges or opportunities that a society may be facing. Age structure, meanwhile, refers to the composition of a population in terms of the relative frequencies of different age groups. These concepts matter because they influence policy making, community planning, healthcare services, education systems, and even marketing strategies targeting specific age demographics.
In a rapidly changing world, being able to interpret and respond to demographic shifts is critical. Countries with a ‘youth bulge’ might face challenges related to providing adequate education and employment opportunities, whereas those with an aging population might need to rethink their pension systems and healthcare strategies. Thus, understanding the implications of population pyramids and age structures not only enlightens us about where a society currently stands but also helps foresee the path it is likely to tread in the future.
Understanding Population Pyramids
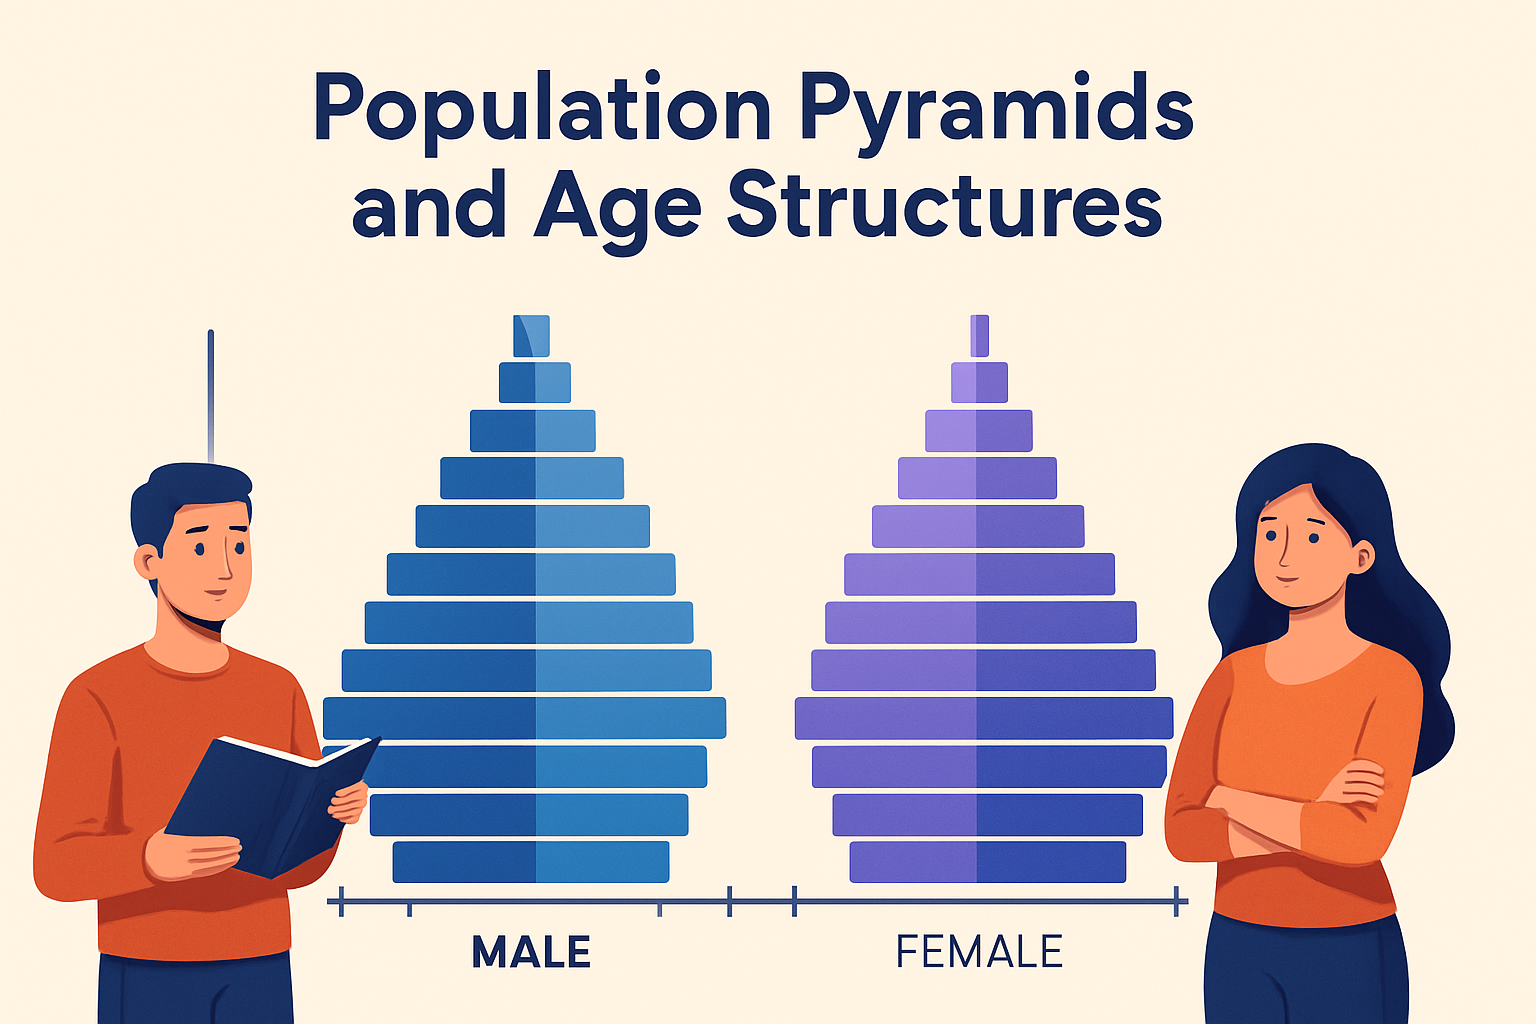
Population pyramids are visually intuitive tools that help to illustrate the age and sex distribution of a population. They often take the shape of a pyramid, hence the name. The horizontal axis of the pyramid captures the population size, while the vertical axis represents age, typically divided into cohorts of five years. On each side of the pyramid, one side shows the proportions of males, and the other depicts females.
Let’s consider three primary types of population pyramids: expansive, constrictive, and stationary. An expansive pyramid has a broad base, indicating a high birth rate and a youthful population. This is common in developing countries where access to healthcare and family planning may be limited, leading to higher birth rates. In contrast, a constrictive pyramid narrows near the base, signaling low birth rates and a significant proportion of older individuals, typical in developed countries. A stationary pyramid showcases relatively even numbers across all age groups, common in countries with low birth and death rates.
An example of an expansive pyramid can be seen in countries like Nigeria, which has a high fertility rate and a growing population. This form indicates a large young population and potential challenges related to providing education and employment. On the other hand, Japan exemplifies a constrictive pyramid, highlighting its aging population and shrinking youth segment. This brings challenges in sustaining economic growth with a reduced working-age population and increased demand for elderly care.
Age Structure and Its Implications
Age structure is a critical component for understanding the demographic profile of any population. Its importance stretches far beyond a mere count of heads within certain age brackets; it intricately weaves into the fabric of economic planning, social services, and policy development.
The age structure is often divided into three basic categories: the youthful age (0-14 years), the working-age (15-64 years), and the elderly age (65 years and older). These categories help analysts and policymakers understand not only the current but also the impending needs of the population. For example, a youthful age structure necessitates investments in educational infrastructure and initiatives aimed at improving child health and wellbeing. Conversely, a predominance of elderly individuals would indicate a focus on healthcare services, pensions, and mobility solutions for older adults.
Consider a country like India, which has a significant proportion of its population in the youthful age bracket, paving the way for potentially immense economic growth due to a large working-age population in upcoming years. However, this also carries the responsibility to create sufficient job opportunities and enhance vocational training to harness this demographic dividend. Meanwhile, European countries such as Germany have a larger share of their population in the elderly category, prompting shifts in pension policies and healthcare resource allocation.
The Connection Between Population Pyramids and Economic Development
The structure of a population is closely interlinked with its economic landscape. Demographics significantly influence labor markets, consumer behavior, and public spending on social services. Understanding the relationship between population pyramids and economic development is essential for informed policymaking and strategic planning.
Countries like China have used insights from their age structure to implement the infamous one-child policy to control population growth. Although successful in curbing population growth, it has resulted in an impending aging crisis. Other countries like Brazil, with a more uniform age distribution, focus on sustainable economic growth driven by a stable working-age population.
The repercussions of demographic shifts manifest in various ways, including labor shortages, shifts in housing markets, and changes in healthcare demand. Economics that once depended heavily on the manufacturing sector may need to pivot towards service-oriented industries, which accommodate older workers and require different skill sets. Additionally, consumer markets may shift towards products and services that cater to health, entertainment, and lifestyle needs of older generations.
- Youthful Populations: Focus is required on educational investments, skill development, and employment creation.
- Aging Populations: Necessitates adjustments in healthcare, social security, and elderly accommodation infrastructure.
- Balancing Act: Economies need to balance providing for both young and elderly to sustain long-term development.
Interpreting Population Pyramids in Policy Making
Population pyramids serve as integral tools for policymakers, offering a clear visual account of demographic trends that can significantly influence public and private sector strategies. Efficient interpretation of these pyramids helps governments implement policies that accommodate demographic realities more effectively.
One of the most impactful areas where population pyramids inform policy is in urban planning. By understanding the detailed age structure of a population within a region, planners can better forecast housing needs, transport infrastructure requirements, and educational facility demands. This planning ensures that burgeoning urban populations are managed sustainably, avoiding strain on existing resources.
Social policies also heavily reliant on demographic data. For instance, nations with aging populations need to rethink pension systems, adapt health care facilities, and possibly raise the retirement age to keep the economy productive. Healthcare strategies can also be devised by looking at the distribution of age groups, focusing more resources on age groups that are more vulnerable to certain diseases.
Furthermore, in countries with a youthful population, effort must be directed towards creating policies that foster economic opportunities and skill development, helping prevent issues like high unemployment rates and social unrest.
Real World Application: Japan’s Aging Society
Japan represents a textbook example of a constrictive population pyramid, which clearly illustrates the challenges of an aging society. Its demographic structure has a large proportion of its population over the age of 65, which is symptomatic of low fertility rates and increased life expectancy.
This age structure has significant implications for Japan’s economy and social policy. The shrinking working-age population contributes to labor shortages, pressing the government to consider measures such as incentivizing longer working years, increasing retirement age, and facilitating women’s participation in the workforce. Additionally, Japan is investing in technology and robotics to fill labor gaps and help care for the elderly, leading in fields such as automation and elderly care innovations.
The situation reinforces the importance of adapting policies and economic structures to accommodate demographic shifts, using the insights gained from population pyramids. This case exemplifies the necessity for proactive policy-making guided by demographic data to sustain economic vitality and improve quality of life for all age sectors.
Conclusion: The Influence of Population Pyramids on Planning and Growth
In conclusion, population pyramids and age structures are invaluable tools in the field of demography that provide insight into the past, present, and potential future of societies. Through simple yet revealing visuals, they help decode the complex dynamics of population growth, aging, and economic dependencies.
The practical applications of these tools in policy-making, economic planning, and social strategic development emphasize their value enormously. From influencing educational funding to adjusting healthcare strategies and pension plans, the implications of population data are far-reaching and profound.
For individuals and organizations alike, familiarizing themselves with reading and interpreting population pyramids can provide a significant advantage. Whether you are planning for business development, investing in new markets, or engaged in public policy, understanding population pyramids equips you to better anticipate and adapt to the powerful forces of demographic change.
As a call to action, readers are encouraged to engage with demographic data sources to further explore the fascinating insights they can provide. By integrating these insights, both individuals and institutions can build more resilient strategies equipped to tackle tomorrow’s challenges.
Frequently Asked Questions
1. What is a population pyramid, and why is it important?
A population pyramid is a graphical representation that shows the distribution of different age groups in a population. This chart usually displays population data in terms of the number or percentage of males and females in each age group, typically represented with males on the left and females on the right. It’s called a “pyramid” because in many cases, it resembles the shape of a pyramid, wide at the younger ages and tapering at older ages.
Understanding population pyramids is crucial because they provide insights into the age structure of a society. This can indicate whether a population is growing, stable, or declining. For example, a triangular-shaped pyramid with a broad base suggests a high birth rate and a growing population. In contrast, a more rectangular shape suggests lower birth and death rates, indicating a stable population. Economists, policymakers, and public health officials use population pyramids to anticipate future needs, such as schools, healthcare, employment, and pensions.
2. How do you read and interpret a population pyramid?
Reading a population pyramid involves analyzing the shape and distribution of the bars representing different age groups for males and females. The base of the pyramid indicates the youngest age cohorts, moving upward to the oldest at the top. The width of the bars represents the number or percentage of people in that specific age group.
To interpret a population pyramid, consider these key aspects:
- Shape: A wide base and narrow top suggest high birth and death rates, typical of a developing country. A more rectangular shape suggests low birth and death rates, often found in developed countries.
- Gender balance: Look at the left and right sides to check for any significant gender imbalances due to historical events, migration, or cultural practices.
- Cohort bulges: Larger bars in certain age cohorts can indicate historical events, like a post-war baby boom, or migration trends affecting population structure.
Ultimately, by reading a population pyramid, one can glean important information about the past, present, and potentially the future demographic trends of a population.
3. What can population pyramids tell us about a country’s development status?
Population pyramids offer significant insights into a country’s level of development. Developing countries often have a classic pyramid shape with a broad base, which reflects high fertility rates and young age populations contributing to a rapid population growth. This suggests many people are in reproductive age, and resources might be channeled toward education and child healthcare.
On the other hand, developed countries may exhibit a more barrel or spindle-shaped pyramid with a relatively even distribution across age groups or a slight bulge towards the middle age cohorts. This indicates lower fertility rates, longer life expectancy, and an older population. In such countries, the economic focus might shift towards healthcare services for the elderly and pension systems.
By assessing a population pyramid, we can recognize developmental challenges and opportunities specific to the country, informing government and policy measures aimed at sustaining growth and welfare.
4. How do age structures affect economic and social policies?
Age structure, visualized through population pyramids, holds profound implications for economic and social policies. The age distribution directly impacts labor markets, education systems, healthcare demands, and pension schemes, aligning policy requirements with the demographic composition.
A youthful age structure suggests a burgeoning workforce in the future, creating a ‘demographic dividend’—a window of opportunity for economic growth if the workforce is well-educated and gainfully employed. Policies may need to focus on expanding educational services, vocational training, and creating job opportunities to harness this demographic advantage.
Conversely, an aging population demands increased investment in healthcare services, retirement planning, and elder care facilities. Governments may need to adjust retirement age policies, enhance support for healthcare infrastructure, and ensure sustainable pension systems.
Thus, understanding the age structure allows for proactive policymaking, enabling the adaptation of economic and social strategies to the evolving needs and potential challenges of a population.
5. What are some limitations of using population pyramids as a demographic tool?
While population pyramids are invaluable for visualizing age structures and forecasting demographic trends, they have several limitations:
- Static Representation: Population pyramids offer a snapshot in time, lacking dynamic components to predict future changes precisely. Unexpected events like pandemics, economic shifts, or migration influxes can rapidly alter demographic landscapes.
- Simplistic View: These charts focus mainly on age and sex distribution, often overlooking other significant variables like ethnicity, economic status, or regional disparities that might influence demographic trends.
- Assumption Dependence: Creating future pyramids relies heavily on assumptions about fertility, mortality, and migration trends. Inaccurate assumptions can lead to misguided forecasts.
- Limited Causality Explanation: While pyramids might highlight demographic patterns, they may not explain the underlying causes or socio-economic factors driving these trends.
Despite these limitations, when combined with other demographic tools and data sources, population pyramids remain a powerful means for understanding demographic shifts and informing public policy and planning effectively.