
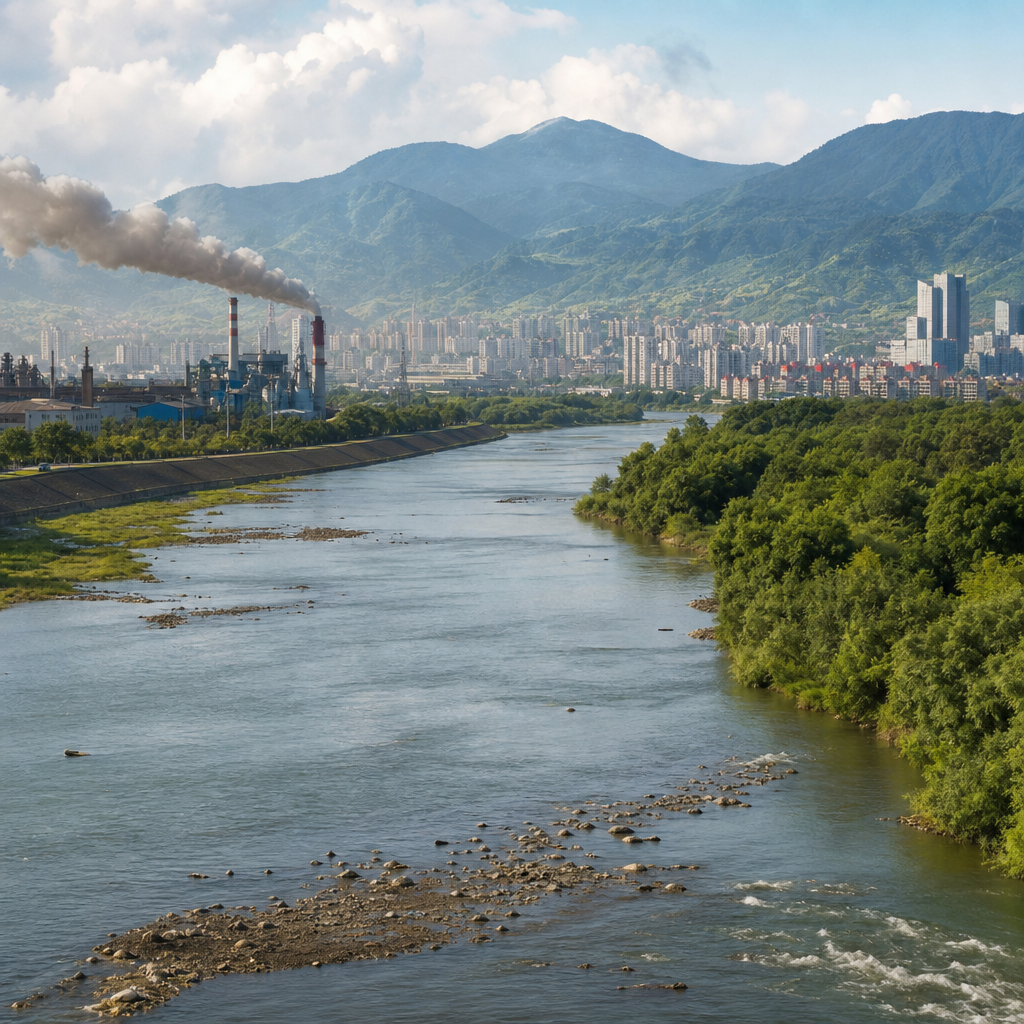
The Environmental Kuznets Curve asks a deceptively simple question: as economies grow richer, do they first pollute more and then, after reaching a turning point, begin to clean up? The idea is central to environmental economics because it links income, industrialization, regulation, technology, and public demand for cleaner air and water into one testable hypothesis. In its classic form, the curve is an inverted U-shape. Pollution rises in low-income stages, peaks at middle-income levels, and falls as income continues to increase. For policymakers, businesses, and researchers, that pattern matters because it suggests whether growth alone can solve environmental damage or whether active intervention is necessary.
The concept draws its name from Simon Kuznets, who studied income inequality and development, though the pollution version emerged later in empirical work on environmental indicators. In practice, the Environmental Kuznets Curve, often shortened to EKC, is not a law of nature. It is a statistical relationship observed for some pollutants in some places during some periods. I have seen this distinction misunderstood repeatedly in economic policy discussions. City officials often assume that rising GDP will automatically deliver cleaner outcomes. It does not. The answer depends on which pollutant is measured, whether emissions are local or global, how trade shifts production across borders, and how seriously governments enforce environmental rules.
Why does this debate matter now? Because countries are trying to grow, reduce poverty, build infrastructure, and cut emissions at the same time. The stakes are high. Air pollution remains one of the largest environmental health risks worldwide, and greenhouse gas emissions continue to drive climate change. If the EKC holds broadly, development might eventually reduce certain forms of pollution. If it does not, relying on income growth without policy reform could lock in long-lived damage. A serious understanding of the Environmental Kuznets Curve helps decision-makers separate what economic growth can achieve from what only regulation, innovation, and institutional capacity can deliver.
What the Environmental Kuznets Curve Actually Says
The Environmental Kuznets Curve proposes that environmental degradation first worsens and later improves as per capita income rises. The mechanism usually combines three effects. First is the scale effect: a larger economy produces more output, uses more energy, and generates more waste. Second is the composition effect: as economies develop, production often shifts from agriculture to manufacturing, then from heavy industry toward services and high-value activities. Third is the technique effect: richer societies can afford cleaner technologies, better enforcement, modern infrastructure, and stricter standards. Whether pollution rises or falls depends on which effect dominates at a given stage of development.
The most important clarification is that the curve applies unevenly across indicators. Local pollutants with immediate health impacts, such as sulfur dioxide, suspended particulates, or some measures of water contamination, have sometimes shown EKC-like behavior. These pollutants are visible, politically salient, and technologically manageable. By contrast, carbon dioxide often does not follow the same pattern. CO2 is a stock pollutant with global effects, and wealthy economies can reduce domestic emissions intensity while still consuming carbon-intensive imports. That means a country may appear cleaner within its borders while outsourcing pollution through global supply chains.
Researchers test the EKC by estimating the relationship between environmental indicators and income using panel data, time series, or cross-country regressions. Typical models include GDP per capita, squared income terms, trade openness, energy mix, urbanization, and institutional quality. Results are highly sensitive to model specification. I have reviewed studies where a small change in the sample period, pollutant definition, or country set moved the estimated turning point dramatically. That is why strong claims should be treated cautiously. The Environmental Kuznets Curve is best understood as a useful framework for analyzing development and pollution, not a universal promise that growth eventually cleans up everything.
Why Pollution May Rise Before It Falls
In the early phases of development, rising pollution is often straightforward to explain. Countries expand electricity generation, transport networks, cement production, steel output, and urban construction. Households buy vehicles, firms mechanize, and cities sprawl faster than regulation can keep pace. Energy systems in this stage frequently depend on coal, diesel, fuel oil, or inefficient biomass. Environmental agencies may exist on paper but lack monitoring equipment, legal independence, or staffing. Under these conditions, the scale effect overwhelms everything else. More production simply means more emissions, wastewater, landfill use, and habitat loss.
Industrial history offers clear examples. During the nineteenth and early twentieth centuries, Britain, the United States, Germany, and Japan industrialized with severe air and water pollution. London’s coal smoke, the Cuyahoga River fires in the United States, and Minamata disease in Japan were not anomalies; they were products of rapid growth combined with weak controls and limited public information. Similar patterns appeared later in many middle-income countries. Fast expansion in manufacturing zones often improved incomes while simultaneously increasing sulfur emissions, contaminated groundwater, and hazardous waste exposure for nearby communities.
Another reason pollution initially rises is political economy. At low income levels, governments prioritize jobs, export earnings, and electrification. Citizens may reasonably tolerate dirty growth if the alternative is unemployment, unreliable power, or persistent poverty. Environmental quality is not irrelevant in poor societies, but immediate economic needs dominate public demands. Firms also resist added costs when margins are thin. Unless standards are enforced uniformly, cleaner producers can be undercut by competitors who externalize environmental damage. This is why early development often produces a tradeoff between output growth and ecological quality, especially where institutions are still maturing.
What Creates the Downward Slope
The decline in pollution, when it occurs, is usually driven by policy and technology rather than income alone. As incomes rise, households demand safer drinking water, cleaner air, green space, and better waste management. These preferences translate into legislation, monitoring systems, and court enforcement. Richer municipalities can finance sewage treatment, waste collection, emissions testing, and transit systems. Firms upgrade equipment because cleaner technologies become affordable and because noncompliance becomes costlier. In my experience, the turning point appears when environmental governance becomes credible, not merely when average income crosses an arbitrary threshold.
Technology plays a decisive role. Power plants can install flue-gas desulfurization units to cut sulfur dioxide. Vehicles can use catalytic converters and low-sulfur fuels. Factories can adopt closed-loop water systems, scrubbers, leak detection, and energy-efficient motors. Grid operators can replace coal with natural gas, nuclear, hydro, wind, or solar depending on local conditions. Digital sensors now allow continuous emissions monitoring, making it harder for facilities to underreport. These changes are not automatic results of prosperity. They require engineering capacity, capital expenditure, maintenance, and regulatory pressure.
Structural change also matters. Economies often move from resource extraction and heavy manufacturing toward finance, software, healthcare, education, logistics, and advanced business services. Measured domestic pollution can fall as the industrial share of GDP declines. However, this creates an accounting problem: some environmental burdens may simply move abroad. A service-heavy rich economy may import steel, aluminum, chemicals, and electronics produced elsewhere. That is why consumption-based emissions and life-cycle analysis are essential complements to territorial pollution statistics. Without them, the downward side of the Environmental Kuznets Curve can look cleaner than the global reality.
What the Evidence Shows Across Pollutants
The empirical record is mixed, and that nuance is the most important takeaway. For sulfur dioxide and some local air pollutants, many studies have found inverted-U patterns, especially in datasets covering industrialization and later regulatory strengthening. Urban air quality in high-income countries improved significantly after clean air legislation, fuel switching, and emissions controls. Water pollution indicators show more varied results because river quality depends on sewage treatment, industrial discharge, agricultural runoff, and hydrology. Some measures improve with income; others do not. Deforestation, biodiversity loss, and material consumption often resist simple EKC patterns because they involve land markets, trade, and long ecological time horizons.
| Pollutant or indicator | How often EKC-like pattern appears | Main reason |
|---|---|---|
| Sulfur dioxide | Often | Visible local harm and mature control technologies |
| Particulate matter | Sometimes | Improves with fuel standards, transit, and industrial controls |
| Water contamination | Mixed | Depends on sewage systems, industry, and agriculture |
| Carbon dioxide | Weak or absent | Global pollutant tied to energy systems and trade |
| Deforestation | Mixed | Land policy, commodity demand, and enforcement dominate |
Carbon dioxide is the sharpest challenge to a simple Environmental Kuznets Curve story. Some wealthy countries have reduced territorial emissions while growing GDP, a trend often called absolute decoupling. Yet this is not universal, and the extent of decoupling depends on energy imports, offshored manufacturing, and the time horizon considered. The United Kingdom, for example, has cut territorial emissions substantially since 1990, helped by coal phaseout, efficiency gains, and a cleaner electricity mix. But consumption-based measures reduce the apparent size of that success because imported goods embody emissions produced elsewhere.
Cross-country institutions shape results as much as income does. Two economies at similar GDP per capita can have very different environmental trajectories if one has strong property rights, transparent permitting, and independent regulators while the other tolerates corruption and weak enforcement. Energy resource endowments matter too. Countries rich in coal may face a harder path than those with abundant hydroelectric potential or access to cleaner fuels. This is why the Environmental Kuznets Curve should never be read as a one-variable explanation. Income matters, but governance, technology, geography, and trade structure determine whether cleaner growth becomes real.
Critiques, Limits, and Common Misreadings
The biggest mistake is treating the EKC as destiny. Growth does not guarantee environmental improvement, and waiting for income to rise can be costly when damage is irreversible. Climate change, species loss, aquifer depletion, and persistent toxins create long-term harms that may not reverse once a country becomes richer. If a coastal wetland is filled, a fishery collapses, or lead exposure damages a generation of children, later income gains do not simply erase those losses. Economists therefore distinguish between pollutants that are easier to abate and environmental assets that are far harder to restore once degraded.
A second critique concerns displacement. High-income countries can appear cleaner because they import pollution-intensive goods rather than producing them domestically. This issue is well documented in global value chains for steel, cement, textiles, electronics, and agriculture. If consumption drives emissions abroad, the local EKC says little about total environmental pressure. That is why border carbon adjustments, supply-chain reporting, and scope 3 emissions accounting are gaining importance. They address the gap between where pollution is generated and where final demand originates.
A third limitation is inequality within countries. National averages can hide severe local exposure. Wealthy metropolitan regions may enjoy cleaner services and tighter enforcement while low-income districts remain near refineries, ports, waste sites, or congested transport corridors. In practical policy work, I have found that environmental improvement is often geographically uneven. Communities with less political influence bear higher risks even after headline indicators improve. Any serious reading of the Environmental Kuznets Curve must therefore ask not only whether average pollution falls, but who benefits, who remains exposed, and how fast the gains spread.
What the EKC Means for Economic Policy Today
The policy lesson is not to reject growth. It is to shape growth so that the turning point arrives earlier, faster, and more equitably. Governments can do this through emissions standards, pollution pricing, removal of fossil-fuel subsidies, public transit investment, building efficiency codes, and clear permitting rules for clean energy infrastructure. The World Bank, OECD, and International Energy Agency have repeatedly shown that regulatory certainty accelerates low-emission investment. When firms know standards will tighten predictably, they adopt cleaner capital sooner instead of locking in outdated equipment.
Developing economies do not need to repeat the dirtiest stages of historical industrialization. They can leapfrog. Utility-scale solar, distributed storage, electric buses, advanced wastewater treatment, satellite monitoring of deforestation, and efficient cookstoves are more available than ever. China’s experience illustrates both sides of the EKC debate: decades of rapid growth produced severe pollution, but aggressive air-quality policies, renewable deployment, and electric vehicle scaling later reduced several urban pollutants even while development continued. The lesson is concrete. Cleaner outcomes came from deliberate policy, investment, and enforcement, not from income growth acting alone.
For readers exploring economics more broadly, the Environmental Kuznets Curve works best as a hub concept linking externalities, public goods, industrial policy, trade, urban economics, energy markets, and institutional development. It explains why environmental outcomes change with development, but it also reveals the limits of market-led adjustment. Growth can create the resources needed for cleanup. Only governance determines whether those resources are used effectively. The practical question for every country is therefore not whether pollution will fade automatically, but how to design development so prosperity and environmental quality improve together. Review your own assumptions about growth and cleanup, and use that perspective to judge policy proposals more carefully.
Frequently Asked Questions
What is the Environmental Kuznets Curve in simple terms?
The Environmental Kuznets Curve, or EKC, is a theory in environmental economics that proposes a specific relationship between economic growth and environmental damage. In its classic version, the relationship looks like an inverted U-shape. At low levels of income, pollution tends to rise as countries industrialize, expand manufacturing, urbanize, and consume more energy. After income reaches a certain threshold, however, pollution may begin to fall because wealthier societies can afford cleaner technologies, stronger environmental regulation, and better public infrastructure. Citizens also tend to demand cleaner air, safer water, and healthier living conditions once basic economic needs are more secure.
The idea matters because it offers a way to think about whether growth itself eventually helps solve environmental problems, or whether deliberate policy is still required. Importantly, the EKC is not a universal law of nature. It is a hypothesis that must be tested for specific pollutants, places, and time periods. Some pollutants, especially local ones like sulfur dioxide or visible smoke, have sometimes shown an EKC-like pattern. Others, especially global pollutants such as carbon dioxide, often do not. That is why the EKC is best understood as a useful framework for asking questions about income, industrial structure, regulation, and technology, not as a guarantee that pollution will automatically disappear as economies get richer.
Why might pollution increase first and then decline as an economy develops?
There are several reasons this pattern could emerge. In the early stages of development, economies usually shift from agriculture toward industry, construction, transport, and large-scale energy use. These activities increase emissions, waste, and resource extraction. Governments may prioritize jobs, exports, electrification, and infrastructure over environmental protection, and environmental institutions may still be weak. Firms often rely on cheap, dirty fuels and older production methods because they are readily available and help keep costs low during rapid expansion.
As income rises further, the economic structure often changes. Heavy industry may become less dominant while services, advanced manufacturing, and knowledge-based sectors expand. At the same time, governments typically gain more fiscal capacity to monitor pollution, enforce standards, invest in wastewater treatment, and build cleaner transit and energy systems. Businesses adopt more efficient technologies because innovation becomes affordable and energy savings matter more. Public preferences also evolve: once people are less focused on immediate survival and basic employment, they tend to push harder for cleaner neighborhoods, healthier workplaces, and stricter environmental rules. Together, these forces can reduce certain kinds of pollution, especially where damage is visible, local, and politically salient.
Does the Environmental Kuznets Curve apply to all forms of pollution?
No. This is one of the most important cautions in the EKC debate. The pattern may fit some pollutants better than others. Local air pollutants such as sulfur dioxide, soot, or particulate emissions have sometimes shown declines after countries become wealthier and adopt tighter controls. Water pollution indicators in some settings have also improved after major investments in sanitation, industrial treatment, and regulation. These are cases where pollution is easier to observe, the health harms are immediate, and the technical fixes are often well understood.
Global and cumulative environmental problems are different. Carbon dioxide is the clearest example. Because climate change is driven by long-lived greenhouse gas emissions tied to energy systems, transport networks, buildings, and land use, rising income does not automatically produce falling emissions. In many wealthy economies, consumption remains energy-intensive, and apparent improvements can reflect outsourcing of dirty production to other countries rather than true reductions in environmental impact. Biodiversity loss, resource depletion, deforestation, and plastic pollution also do not consistently follow a simple inverted U-shape. For that reason, researchers usually ask a narrower question: for which pollutant, in which country or region, over what period, and using what measurement? The answer often varies substantially.
What are the biggest criticisms of the Environmental Kuznets Curve?
The biggest criticism is that the EKC can be interpreted too optimistically, as if growth alone will solve environmental problems. In reality, many observed improvements in pollution have depended on active policy choices such as emissions standards, clean fuel mandates, monitoring systems, zoning rules, protected areas, and public investment. Without those interventions, pollution may continue rising or decline far more slowly. Critics also point out that some apparent EKC patterns are statistical artifacts caused by model specification, limited data, or the choice of pollution indicator.
Another major concern is pollution displacement. A high-income country may appear cleaner domestically because it has moved heavy industry abroad and now imports emissions-intensive goods. In that case, local pollution falls while global environmental pressure remains high. There is also the issue of irreversibility: even if pollution eventually declines, earlier damage may leave lasting harms to ecosystems, public health, or the climate. Waiting for income to reach a turning point can therefore be extremely costly. Finally, not all countries follow the same development path. Energy mix, institutions, urban design, trade structure, political priorities, and access to technology all influence environmental outcomes. These criticisms do not make the EKC useless, but they do mean it should be treated as a conditional and contested empirical idea rather than a universal rule.
What does the Environmental Kuznets Curve imply for environmental policy today?
The main policy lesson is that growth is not enough by itself. If policymakers assume that pollution will naturally fall once income rises, they risk delaying action and locking economies into dirty infrastructure. A more practical interpretation of the EKC is that higher incomes can create the capacity for environmental improvement, but only if that capacity is translated into effective institutions, regulation, innovation, and public investment. In other words, the turning point, if it exists, is shaped by policy. Countries can potentially reach it earlier and with less damage by adopting cleaner technologies, pricing pollution, strengthening enforcement, and designing cities and transport systems that reduce emissions from the start.
This is especially important for climate policy. Unlike some local pollutants, greenhouse gases cannot be safely managed through a “pollute first, clean up later” strategy because cumulative emissions matter. Modern policy therefore focuses on decoupling growth from environmental harm as early as possible. That includes expanding renewable energy, improving efficiency, supporting electrification, protecting forests, promoting circular economy practices, and measuring emissions on a consumption basis as well as a production basis. The broader takeaway is clear: the EKC is most useful when it prompts better questions about how development, institutions, and technology interact, not when it is used as a reason for complacency.