
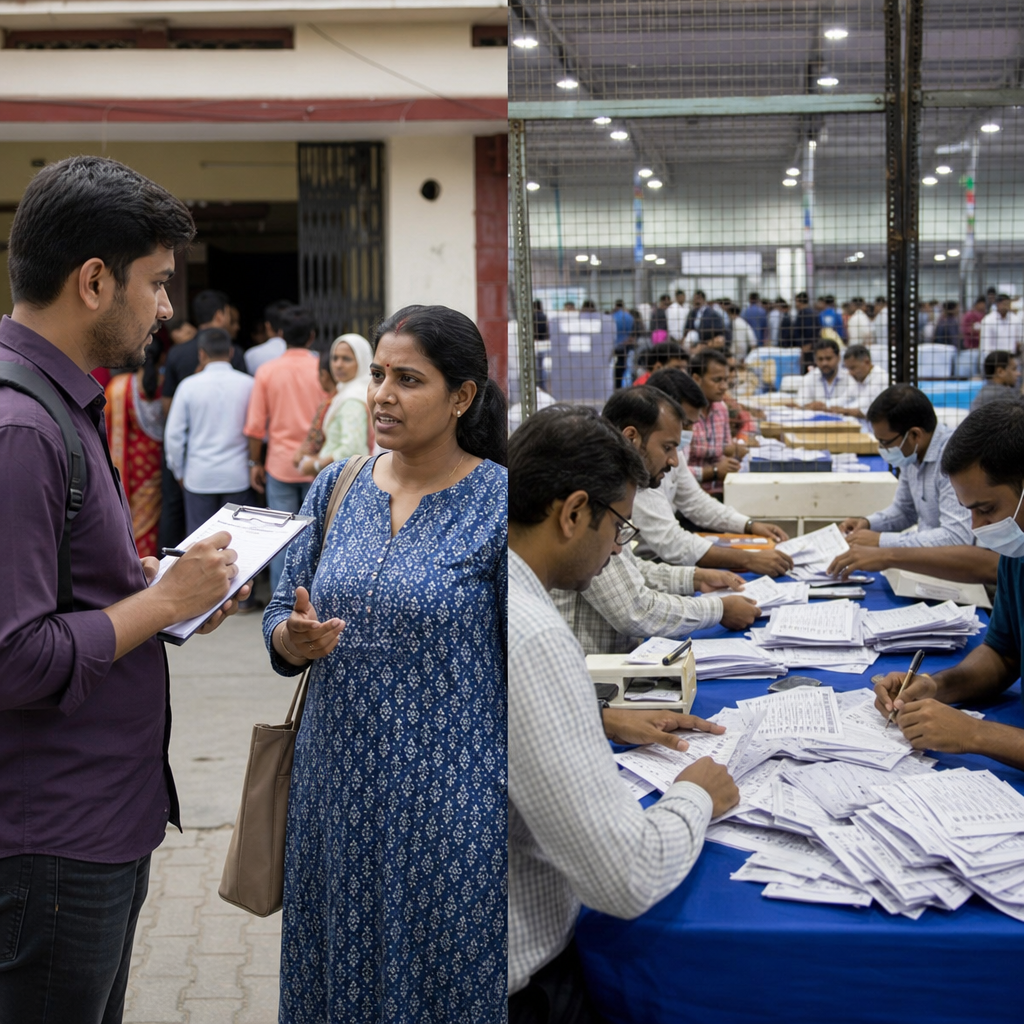
Exit polls and election results often point in different directions because they measure different things, at different times, under imperfect conditions, and that gap matters for anyone studying AP Government and Politics. An exit poll is a survey of voters taken as they leave a polling place or, increasingly, after they vote by mail or early ballot through phone and online follow-ups. Election results are the official counts reported by local jurisdictions, certified under state law, and sometimes updated for days or weeks as provisional, absentee, military, and cured ballots are processed. I have worked with election data releases on live decision desks, and the first lesson is always the same: a survey is an estimate, while a result is a count. Students, teachers, and general readers need to understand that distinction because exit polls shape media narratives, campaign strategy, and public trust, yet they are not designed to replace certified returns.
In AP Government terms, this topic connects polling, political behavior, federalism, media effects, and legitimacy. It also sits inside a broader set of misc election concepts that students frequently confuse, including sampling error, weighting, voter turnout, early voting, provisional ballots, and certification timelines. When commentators say an exit poll was “wrong,” the reality is usually more nuanced. The survey may have captured Election Day in-person voters accurately but missed late shifts in the electorate, undercounted certain groups, or been adjusted against incomplete vote totals during the night. The official result may also change meaningfully after election night because large urban counties often report later than small rural ones, and mailed ballots can lean differently from same-day votes. Understanding why exit polls and election results sometimes diverge helps readers interpret headlines carefully and avoid overstating fraud, bias, or manipulation without evidence.
What Exit Polls Measure and Why Newsrooms Use Them
Exit polls are built to answer questions that vote totals alone cannot answer. Official returns tell us who won and by how much, but they do not tell us how women without college degrees voted, whether first-time voters broke toward one party, or which issues mattered most to suburban independents. To answer those questions, major media organizations commission standardized surveys from firms such as Edison Research, historically used by the National Election Pool. Interviewers sample selected precincts and ask voters to complete anonymous questionnaires; for absentee and early voters, researchers often use telephone or online methods because those voters never appear at a precinct exit. The goal is not just prediction. The goal is explanation: who voted, why they voted, and what demographic and attitudinal patterns defined the electorate.
That explanatory role is why exit polls remain central to election coverage and classroom analysis. In practice, however, they are complex statistical products. Precincts are sampled rather than fully observed, response rates vary, and raw responses are weighted to reflect expected turnout patterns. Analysts compare incoming data with historical benchmarks, voter file information, and actual returns as they become available. On a live desk, I have seen early exit poll tabs look dramatic at 5 p.m. and settle into a far less surprising picture by midnight after weighting revisions and county results come in. That does not mean anyone fabricated numbers. It means the survey was being calibrated as real evidence accumulated. For AP Government students, the key point is that exit polls are instruments for inference, and inference always carries uncertainty.
Why Official Election Results Change After Election Night
Many apparent divergences come from misunderstanding what “election results” means. The number displayed on television at 9:30 p.m. is not the final certified result. It is a partial tabulation based on whatever counties have reported at that moment. States follow different rules for processing mailed ballots, signature verification, curing rejected ballots, and counting provisional ballots cast by voters whose eligibility required additional review. California is a classic example: its large volume of vote-by-mail ballots and lengthy curing window often means the margin shifts for days. Pennsylvania and Wisconsin have also shown how restrictions on pre-processing mailed ballots can delay totals and make election-night returns unrepresentative of the final electorate.
This reporting lag creates what election analysts call the “red mirage” or “blue shift,” depending on which type of vote is reported first and which party tends to use that method more heavily. In 2020, many Republican-leaning Election Day votes were counted earlier in some states, while heavily Democratic mail ballots were added later. Exit polls fielded across both in-person and absentee populations might look inconsistent with the first returns but closer to the final certified result. The reverse can also happen if absentee follow-up samples are weaker than precinct samples. The essential lesson is simple: official election results are a moving target until certification, and comparing a finalized exit poll estimate to a partial vote count is analytically unsound.
Sampling Error, Nonresponse, and Weighting Problems
The most direct reason exit polls diverge from election results is ordinary survey error. Any sample can miss the true composition of the electorate, especially when participation is uneven across groups. Younger voters may be less willing to stop for interviewers. Highly educated voters may respond at higher rates than working-class voters. In heavily partisan environments, supporters of the losing side sometimes become less willing to answer post-election surveys, producing what researchers call differential nonresponse. If the people who refuse the survey differ systematically from those who complete it, the sample becomes skewed even if the original precinct design was solid.
Weighting is supposed to reduce that skew, but weighting depends on assumptions. Analysts may weight by gender, age, race, education, geography, and vote history, yet those categories interact in complicated ways. A sample can appear balanced on separate variables and still miss the correct combination, such as noncollege Hispanic men in exurban counties. This issue became more visible after 2016, when many pollsters concluded that education weighting had not been strong enough in several state polls. Exit polling has related challenges. A precinct-based design can capture where people voted but still underrepresent how specific subgroups within those precincts behaved. When students hear “margin of error,” they should remember that it reflects random sampling error under ideal conditions; it does not fully capture bias caused by poor response patterns, mode effects, or bad likely-voter assumptions.
How Voting Methods Complicate Exit Poll Accuracy
Modern elections are no longer dominated by people who show up on one Tuesday and leave through a precinct doorway. Early in-person voting, no-excuse absentee voting, drop boxes, and universal mail ballot systems have transformed the electorate. That transformation makes the phrase “exit poll” slightly outdated. Pollsters now need hybrid methods to reach people who voted days or weeks earlier. Phone and online surveys can supplement precinct interviews, but they introduce their own problems: lower contact rates, different social desirability pressures, and harder verification that a respondent actually voted as claimed.
These method differences matter because voting mode is not random. In many recent elections, vote-by-mail users have skewed older in some states and more Democratic in others, while Election Day voters have leaned more Republican in several battlegrounds. During the COVID-19 pandemic, those splits became especially pronounced. If the absentee sample underestimates one party’s strength by just a few points, the full exit poll can miss the statewide result even while the precinct component performs well. This is one reason analysts increasingly pair exit polls with voter file analysis, county return patterns, and precinct-level historical comparisons. No single instrument captures the whole electorate perfectly once voting is spread across multiple modes and weeks.
Why Demographic Findings Can Be Useful Even When the Topline Misses
A common mistake is assuming that if an exit poll misses the final margin, every demographic finding inside it is worthless. That is too broad. Some findings remain directionally useful, especially when they align with precinct returns, validated voter files, and later academic studies. For example, exit polls in recent cycles have consistently highlighted educational polarization, with college-educated suburban voters trending differently from noncollege rural voters. They have also captured issue salience patterns, such as inflation, abortion, immigration, or democracy concerns ranking differently across party coalitions. Even if the exact statewide margin is off by two points, those broader patterns may still hold.
That said, subgroup claims require caution because subgroup samples are smaller and noisier than the full sample. If a state exit poll reports that Asian American voters supported one candidate 57 to 41, readers should ask about sample size, language accessibility, regional concentration, and whether the category combines politically distinct communities. This is why organizations like AP VoteCast emerged as alternatives or complements in some contexts, aiming to capture a broader electorate and provide more robust issue and demographic analysis. For AP Government students, the disciplined approach is to use exit poll subgroup data as evidence, not proof, and to compare it with Census benchmarks, Catalist-style voter file analyses, and county-level returns before drawing firm conclusions.
Common Reasons Exit Polls and Results Diverge
| Reason | What happens in practice | Example of the effect |
|---|---|---|
| Partial vote count | Election-night returns reflect only reported precincts or counties | Urban mail ballots arrive later and shift the margin after midnight |
| Nonresponse bias | Certain voters decline interviews more often than others | Working-class voters are underrepresented in the completed sample |
| Weak absentee sample | Mail and early voters are measured through separate methods | A state with heavy vote-by-mail usage is misread despite solid precinct interviews |
| Weighting error | Analysts adjust the sample using assumptions that miss the true electorate | Education or race by region is balanced incorrectly |
| Late counting rules | Provisional, military, or cured ballots are added after election night | A close contest narrows or widens during canvassing and certification |
Real-World Examples That Explain the Gap
Several election cycles illustrate these dynamics clearly. In 2004, early exit poll leaks suggested John Kerry might outperform expectations, creating a wave of online speculation before official returns showed George W. Bush winning reelection. The problem was not that vote counters reversed the outcome; it was that preliminary survey data had not yet been fully weighted and should never have been treated as final. In 2016, state-level polling errors in parts of the Upper Midwest prompted renewed scrutiny of education weighting and rural response patterns. Exit poll interpretations also struggled to cleanly summarize a fragmented electorate whose partisan alignment had shifted faster than many models anticipated.
The 2020 election provided another textbook case. In-person Election Day voting and mail voting were sharply sorted by party in many states. Early returns in places that counted Election Day ballots first looked more Republican than the eventual totals, while states that processed mail earlier looked different. Commentators who compared partial returns to broad survey narratives often made the divergence seem suspicious when it was actually procedural. In 2022, some analysts found that issue-based polling on abortion and candidate quality explained outcomes better than simplistic horse-race assumptions. Across these examples, the durable lesson is that divergence usually reflects method, timing, and composition, not misconduct. Good analysis asks how the data were collected, what electorate was covered, and whether the comparison is being made at the same stage of counting.
How Students and Voters Should Interpret Exit Polls Responsibly
The best way to read exit polls is to treat them as one source among several. First, check whether the numbers are preliminary or revised. Second, separate national patterns from state-specific claims; national demographic stories can mask very different state coalitions. Third, look for the mode split: did the survey include absentee and early voters, and how were they reached? Fourth, compare survey findings with county returns, historical turnout, and official certification rules. If a state still has large uncounted mail ballot pools in major metro counties, do not assume the election-night margin reflects the final result. If a subgroup finding is based on a small sample, avoid overconfident conclusions.
For AP Government and Politics, this hub topic reinforces a larger civic skill: evaluating political information without drifting into cynicism or gullibility. Polls are useful, but they are not omniscient. Official results are authoritative, but they are not instantaneous. Media narratives can clarify, yet they can also compress uncertainty into misleading certainty. Readers who understand sampling, turnout, federalism, and certification are far better equipped to interpret contested elections calmly. The practical benefit is straightforward: you can distinguish between a normal statistical or procedural gap and a claim that requires real evidence. Use that habit across the entire misc elections landscape, from turnout estimates to recounts to ballot access disputes. The next time exit polls and election results diverge, ask better questions, follow the counting rules, and wait for the complete record.
Frequently Asked Questions
What is the main difference between an exit poll and official election results?
The core difference is that exit polls are estimates, while election results are the official vote totals. An exit poll is a survey of people who have already voted, designed to help researchers and media organizations understand who voted, why they voted that way, and what issues mattered most to them. It is based on a sample, not a full count, which means it is always subject to statistical uncertainty, nonresponse, and methodological limits. Even when done carefully, an exit poll is still trying to infer the preferences of the entire electorate from a smaller group of respondents.
Official election results work very differently. They are produced through the formal counting of ballots by election administrators in local jurisdictions, then reported and eventually certified under state law. Those totals include in-person ballots, early votes, mail ballots, provisional ballots that are accepted, and other valid votes counted according to legal procedures. In other words, election results are not trying to estimate voter behavior; they are trying to tally every legally cast ballot.
That distinction matters a great deal in AP Government and Politics because it highlights the difference between public opinion measurement and formal democratic outcomes. Exit polls can be useful for identifying broad patterns, such as whether younger voters favored one candidate or whether the economy drove turnout. But if the question is who actually won, by how many votes, and under what legally recognized count, the election results are the final authority.
Why do exit polls sometimes show a different winner or margin than the final election results?
Exit polls can diverge from final results for several reasons, and most of them have to do with the fact that surveys are imperfect snapshots rather than complete counts. First, exit polls depend on sampling. Pollsters choose certain precincts and then survey some voters at those locations, but no sample perfectly mirrors the full electorate. If the sample overrepresents one kind of voter and underrepresents another, the topline estimate can be off.
Second, not everyone agrees to participate. This is known as nonresponse bias, and it is one of the biggest challenges in modern polling. If supporters of one candidate are less likely to fill out questionnaires or answer follow-up calls and online surveys, the poll can lean in the wrong direction even if the selection process looked sound at the start. Weighting can help correct for some of that imbalance, but weighting is itself based on assumptions and available data.
Third, today’s voting process is spread out over time. Many voters cast ballots before Election Day through early in-person voting or by mail. Traditional exit polling originally focused on people leaving polling places on Election Day, but that no longer captures the whole electorate. To adjust, polling organizations often add telephone or online surveys of early and mail voters, which introduces additional methodological complexity. If those groups are harder to reach or behave differently than Election Day voters, the estimates can drift away from the final count.
Fourth, the vote count itself unfolds over time. Some ballots are counted quickly, while others, especially mail ballots or provisional ballots, may be processed later depending on state rules. That means early unofficial returns may not match either the exit poll or the eventual certified result. In close races, even small survey errors can make it appear that the poll and the final count are contradicting each other when the difference is simply the result of timing and uncertainty.
How do early voting, mail voting, and provisional ballots make exit polling more difficult?
They make exit polling harder because they weaken the original model on which exit polls were built: interviewing people as they physically leave a polling place on Election Day. When a large share of the electorate votes days or weeks earlier, or submits a ballot by mail, there is no single “exit” moment that is easy to observe. Pollsters must therefore combine multiple methods, such as precinct-based questionnaires, phone outreach, and online surveys, to capture the full voting population.
That mixed-method approach creates additional opportunities for error. Early voters and mail voters may differ from Election Day voters in age, education, partisan preference, or motivation. They may also be harder to contact or less willing to respond after voting. If those groups are not measured accurately, the final exit poll estimate can misstate both turnout patterns and candidate support.
Provisional ballots add another layer of complexity because they are not always included in the same way at the same time. A voter may cast a provisional ballot if there is a question about registration status, identification, or precinct assignment. Those ballots are reviewed later to determine whether they should be counted. Exit poll respondents may report having voted, but the official result will only include ballots ultimately deemed valid. That means the survey may capture intent or participation at the moment, while the certified election result reflects the legal counting process after review.
For students of government, this is a useful reminder that elections are not just political events; they are administrative and legal processes. The modern expansion of voting methods has made participation more flexible, but it has also made measuring the electorate in real time more complicated.
Are exit polls unreliable, or do they still serve an important purpose?
Exit polls are not useless or inherently unreliable, but they should be understood for what they are: analytical tools, not official verdicts. Their greatest value is that they provide insight that raw election returns cannot. Official results tell us how many votes each candidate received, but they do not explain why voters made those choices, what issues shaped their decisions, or how different demographic and political groups behaved. Exit polls attempt to fill in that gap.
For example, exit polls can help identify whether inflation, abortion, immigration, or perceptions of democracy were especially important to voters in a given election. They can also offer estimates about the behavior of groups such as independents, suburban voters, first-time voters, or college graduates. Those findings are often central to media analysis, campaign strategy, and academic discussion.
That said, exit polls do have clear limitations. They can miss key segments of the electorate, especially if response rates are uneven. They can be less accurate in specific states or districts than at the national level. And they are often revised as better turnout data becomes available. So the best way to think about them is not as a replacement for election results, but as a supplement to them. They are most useful when interpreted cautiously, in combination with certified vote totals and other data sources.
In an AP Government context, that distinction is especially important because it reflects a larger theme in political science: measuring public behavior often involves trade-offs between speed, depth, and precision. Exit polls give quick and meaningful clues, but official counts remain the democratic standard.
What should students, voters, and news consumers keep in mind when exit polls and election results do not match?
The first thing to remember is that a mismatch does not automatically mean something improper has happened. In most cases, divergence reflects normal differences between a survey estimate and a full legal count. Exit polls measure responses from a sample of voters under time pressure and imperfect conditions. Election results emerge through a slower process of ballot collection, verification, tabulation, and certification. Because those are fundamentally different activities, some gap between them is not surprising.
It is also important to pay attention to timing. Election Night is often treated as if everything should be known immediately, but the official count continues after polls close. Different states process and report ballots according to different rules, especially when mail ballots arrive late but legally on time, or when provisional ballots must be reviewed. Early returns may change significantly as more votes are added, and those later changes can make an initial exit poll look better or worse in hindsight.
Another key point is that one exit poll number should never be treated as a complete picture of the electorate. Sampling error, weighting decisions, question wording, and turnout assumptions all shape the result. Credible interpretation requires looking at methodology, sample size, and whether findings are consistent with other evidence. News consumers should be skeptical of dramatic claims based on a single poll-release moment, especially in close contests.
Finally, students should see this issue as a practical example of how democratic institutions actually function. Elections involve voters, parties, campaigns, media organizations, pollsters, and state and local administrators, all operating with different goals and methods. Exit polls are designed to interpret the electorate quickly; election results are designed to determine outcomes accurately and lawfully. Understanding why they sometimes diverge is part of understanding how modern democracy works.